1) Measures of central tendency
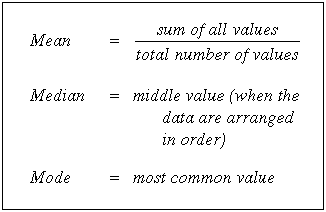
The concept of central tendency is to describe the 'average' or 'most typical' value of a distribution. These are ways of producing a figure that best represents the 'middle point' in the data. The three most common measures of central tendency are: the mean, the median, and the mode.
-The mean
The arithmetic mean is most people's notion of what an average is. The mean is equal to the sum of all values in the data set divided by the number of values in the data set. It should be calculated for interval/ratio data. The mean is also influenced by the outliers that may be at the extreme of data set.
-The median
The median is simply the middle value in a distribution when the data are ranked orderly. The median is the most suitable measure of central tendency for ordinal data. It is also widely used with interval/ratio data. We usually prefer the median over the mean or mode when the data is skewed.
-The mode
The mode is the value that occurs most frequently in the distribution. It is appropriate for nominal data.


2) Measures of dispersion
These are ways of summarizing a group of data by describing how spread out the scores are. When dealing with ordinal data we are restricted to the range and interquartile range, while the variance and standard deviation are usually calculated for interval/ratio data. In addition, there are no appropriate measures of dispersion for nominal data.
-The range
The range is calculated by subtracting the smallest value from the large.
-The interquartile range
The interquartile is designed to overcome the main flaw of the range by eliminating the most extreme scores in the distribution. It is obtained by ordering the data from lowest to highest, then divided into four equal parts (quartiles) and concentrate on the middle 50% of the distribution.

-The variance
The main problem with the variance is that the individual differences from the mean have been squared. It is not measured in the same units as the original variable. To remove the effect of squaring, we obtain the square root of the variance, more commonly referred to 'the standard deviation'.
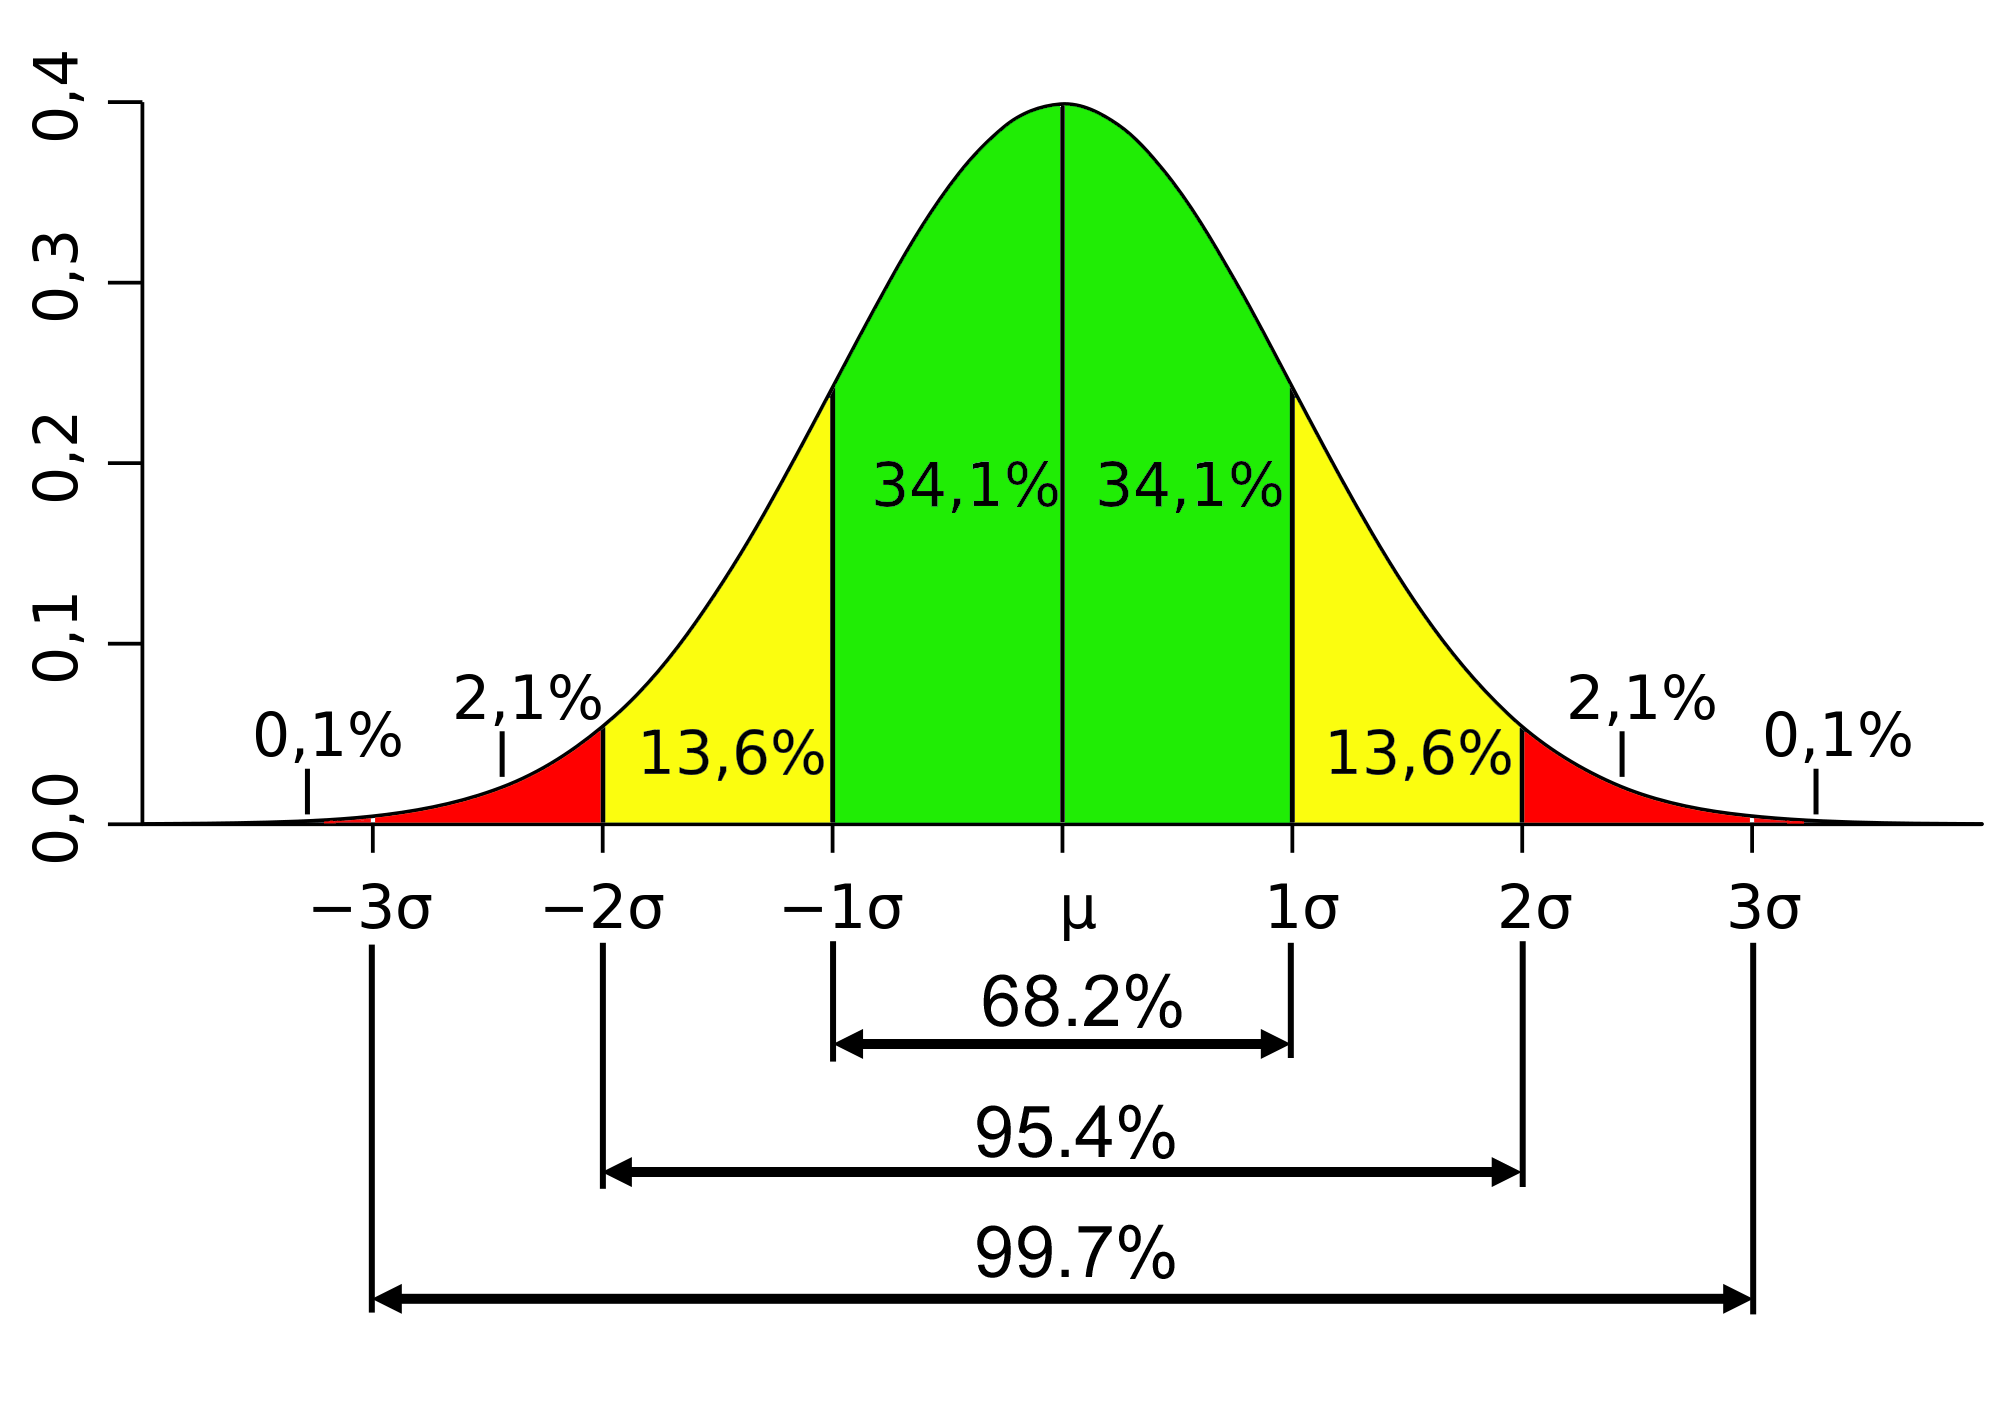
The variance and standard deviation tell us how widely dispersed the values in a distribution are around the mean. The variance represents the average squared deviation from the mean. If the values are closely concentrate around the mean, the variance will be small.
-The standard deviation
The standard deviation is calculated the square root of the variance. It is the most widely used measure of dispersion. However, it can be distorted by a small number of extreme values.

Notes: It is advisable to check the data for any unusual high or low values before employing these kinds of statistics.
No comments:
Post a Comment